|
 Analysis Bars Analysis Bars
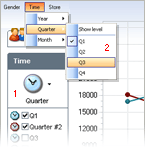
Chart FX OLAP includes an Analysis Bar that allows users to select dimensions to
analyze within the chart. The Analysis Bar may be toggled between either the Category
Bar [1] or Menu Bar [2]
styles. The Category Bar allows users to select from the available dimensions and
levels for display in the chart. Alternatively, the Menu Bar provides the same functionality
but takes less space.
UI Data Filtering
The Category Bar provides a series of checkboxes representing the values for a selected
level that enable the user to filter the data displayed in the chart. To filter
the values, simply check or uncheck the available values to show or hide them in
the displayed chart. (See
it in action)
Pivoting Data
The Chart FX OLAP Extension also allows end users to pivot data in the chart to
change the dimensional orientation. Dragging the LegendBox or X-axis labels to another
position will allow users to transpose (swap the rows and columns) data in the chart.
(See
it in action)
Drill-down Capabilities
The OLAP Extension supports analysis and drill down functionality allowing end users
to analyze a level individually, or drill down to a selected level to analyze the
subordinate values which comprise the selected level.
*Note: The Chart FX Extensions Pack will accommodate itself to features available
in Chart FX 7. Not all features available in Chart FX 7 are available in Chart FX
for .NET (2003). Please consult your Core Product's documentation for specific feature
information.
|


