Chart FX for Reporting Services leverages the charting features from the award winning
Chart FX charting engine.
Plus it's just as easy to add this powerful technology to your reporting projects.
Now with the inclusion of Gauge gallery types you can embellish your reports with
highly detailed, realistic gauge representations. Included are Radial, Horizontal,
Vertical, Digital Meter and LED Panel Gauge types.
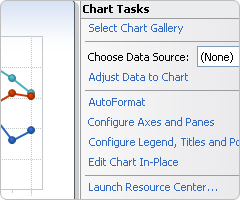
Chart Wizard
When you drop a chart in your report, a Smart Tag appears in the upper right-hand
corner of the control. This allows you easy access to Chart FX's main features.
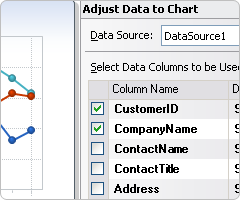
Data Wizard
Connecting and configuring your chart to your datasource is a snap with the Chart
FX Data Wizard. Simply select your datasource and follow the simple instructions
and your chart will adapt to the type and content of the data you provide.
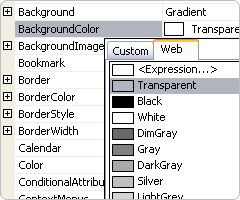
Property Grid
Users can choose to manipulate their chart using the familiar Property Grid in the
Reporting Services IDE.

Resource Center
Everything you need to know to create beautiful charts for your reports is contained
in the elegant new Resource Center.
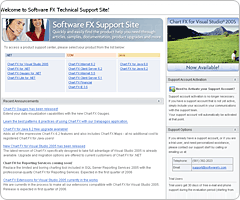
Comprehensive Support
Chart FX products are known for their high level of professional support and users
have access to our comprehensive support site and a robust online community. You
may also upgrade to professional, direct email and phone support.
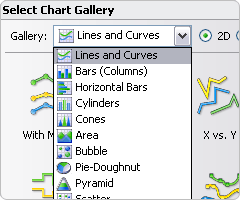
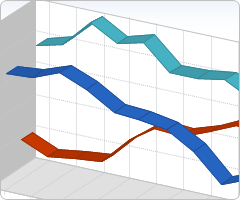
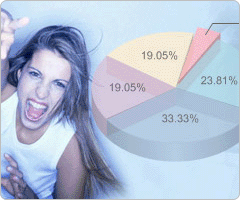
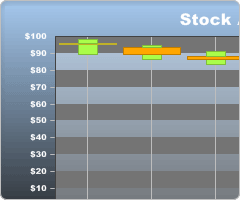
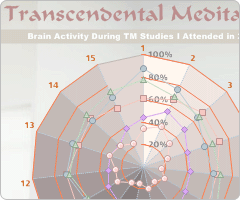
Multiple Gallery Types
20 different
chart types including Lines, Curves, Bars,
Horizontal Bars, Cylinders, Cones, Area, Bubble, Pie, Doughnut, Pyramid, Scatter,
Open-Hi-Low-Close, Candlestick, Surface, Contour, Radar and Polar.
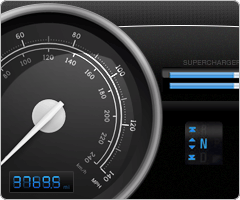
Gauge Gallery Types
Extend your charting capabilities with Radial, Horizontal, Vertical, Digital Meter
and LED Panel gauge types.
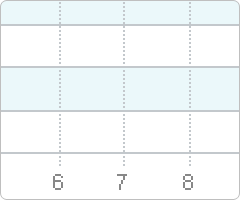
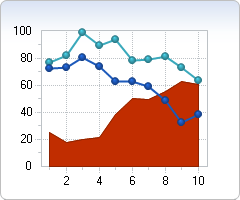
Grid Lines
Grid Lines are highly customizable, horizontal and vertical lines used to separate
or highlight an area.
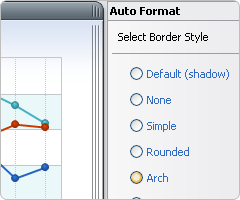
Artistic Borders
Add visual pizazz to your charts by selecting from standard (flat, raised, sunken,
etc.) or artistic borders (embossed, embedded, riveted, etc).
2D/3D Rendering
Most charts can be viewed in 2D or 3D and can be rotated to specific angles and
perspectives.
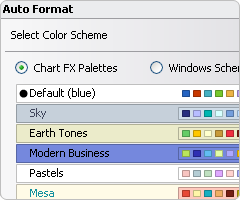
Color Palettes
Apply predefined color palettes to your chart for an artistic, uniform look.
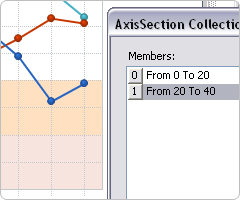
Axis Sections
Highlight certain value ranges in individual axes with editable axis sections.
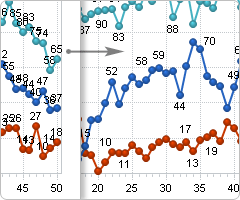
Point Labels
Show the value of each marker. Font, color, position and angle can be changed universally
or individually for each marker.
Background Images
Add images, such as a company logo or any other preferred image, to the background
of the chart.
Legends
Series and/or points legends can be shown in different positions: stacked (customizable,
left, top, right, bottom, near, center, far, spread) or floating anywhere in the
chart.
Gradients
Add gradients to the chart's main and/or inside background or to each series for
an artistic touch.
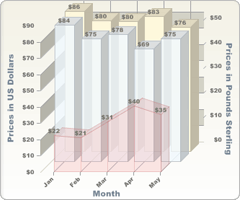
Multiple Axes
Chart FX for Reporting Services fully supports multiple X and Y Axes.
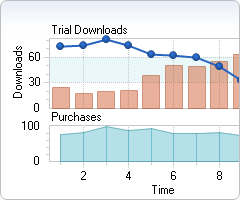
Multiple Panes
Chart FX for Reporting Services allows you to render multiple panes within the same
chart. You can compare multiple unrelated entities which share an X axis, all on
the same chart.
Titles
Chart FX for Reporting Services supports multiple titles for the chart and each
axis. Each title can have its own font and color.
Point Label Collision Detection
Intelligently distributes the point labels to prevent overlapping.
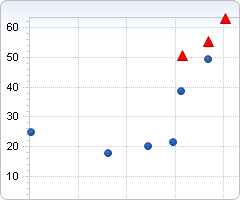
Conditional Attributes
Highlight values based on conditions you define in the Properties Grid.
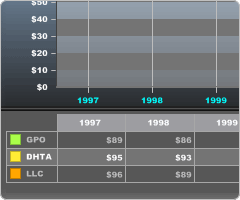
Data Grid
A tabular display used to view the specific data that is fed to the chart.
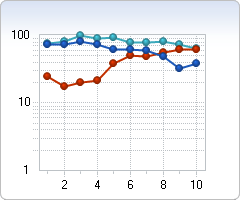
Logarithmic Axes
When plotting large numbers, Chart FX supports independent logarithmic scales on
any of the axes (Primary, Secondary Y and X when used in a numerical sense).
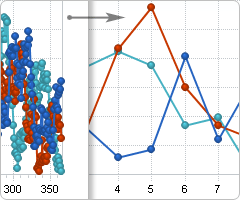
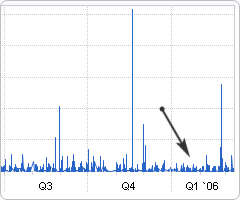
Data Compacting
The Data Compacting feature will provide meaningful, summarized data when your raw
data is extremely lengthy and would not normally be useful in a chart.
Per Series Attributes
Chart FX allows you to set visual attributes such as color, gallery type and marker
type per series.
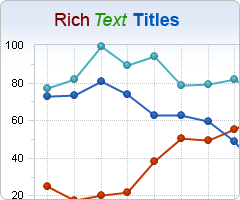
Rich Text Titles
Include Rich Text format (similar to html tags) in the titles such as <b>Bold</b>,
<i>Italic</i>, etc.
Smart DateTime Axis Handling
Automatically adjusts the labels for Date/Time axes to show meaningful periods of
time, such as months, quarter, years, etc.