PowerGadgets Features
PowerGadgets leverages PowerShell to create gadgets in Windows XP and Windows Vista
without being limited to events or indicators that are predefined by other server
manageability and monitoring applications.
PowerGadgets Core Cmdlets
Once you have provisioned your computer with Windows PowerShell and PowerGadgets
you can start creating visually rich gadgets in Windows Vista and Windows XP. PowerGadgets
provides 3 main cmdlets:
-
Out-chart

PowerGadgets provides a powerful charting engine providing over 60 chart types and
a wealth of aesthetical and functional features. A chart plots data in the form
of series and points with each series containing one or more points.
-
Out-gauge

PowerGadgets provides an out-gauge cmdlet to display single-variable data in radial, linear and
digital-panel gauges. Single-variable analysis is very powerful when
combined with PowerGadgets' flexible real-time capabilities.
-
Out-map

PowerGadgets provides a mapping component that allows you to depict enterprise data
on geographical maps or even on your own custom SVGs. PowerGadgets includes a comprehensive
SVG map library that covers most geographic mapping needs.
Graphical Wizards and Templates

PowerGadgets exposes the same design-time experience found in much more graphical
design surfaces like Visual Studio. Just add the
-configure
switch to any of your PowerGadgets cmdlets and a powerful graphical Wizard that
allows simple customization of chart, map and gauge settings. When used, a configuration
file (template) is saved (My Documents folder) and you can then use the
-template
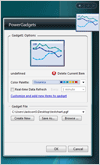
switch to load and apply these settings quickly and easily. This script below will
give you access to the PowerGadgets wizard which provides a GUI for quickly customizing
the chart elements. As you manipulate properties, the chart will display the changes.
You can save these settings and use them to overwrite the default PowerGadgets values.
To invoke the wizard:
get-process | out-chart -configure -template MyChartTemplate
Innovative Functionality
Powerful Real-Time Engine

PowerGadgets provides real-time serialization and execution of the entire command
so you can monitor real-time data from your desktop using a combination of visually-rich
charts, gauges and maps.
No Coding Involved

PowerGadgets exposes the same design-time experience found in much more graphical
design surfaces like Visual Studio. Simply use PowerGadgets' graphical Wizards to
change settings.
SQL Server Connectivity

PowerGadgets can easily connect to a SQL Server (or any ODBC-compliant database)
and extract information. Running a SQL query from your desktop is as easy as typing
into a command window.
Easy Distribution and Deployment

To restribute a PowerGadgets file, simply email or copy the gadget files to another
system. A user with a valid license of PowerGadgets installed can then double click
to display the gadget!
Multiple Windows Environments

PowerGadgets will run in Windows XP, Windows Vista, Windows Server 2003 and Windows
Server environments and can run in either the desktop or on the Windows Vista Sidebar.
PowerGadgets Forums

A Sidenote About Windows Sidebar
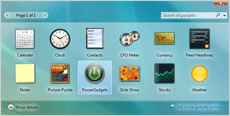
Windows Vista provides the Windows Sidebar to manage gadgets. When installed, PowerGadgets
also installs the necessary files to create .gadget files in Windows Sidebar.

With Windows Sidebar open, double-click on the PowerGadgets icon and a placeholder
gadget will appear in Sidebar. The final step in making a gadget functional is to
write a PowerShell script adding the -sidebar switch with the identifier of the
gadget you want to use. For example, to create a chart with the machine processes,
you can write the following script in PowerShell:
get-process | out-chart -sidebar gadget1
This script will bind the data and create your gadget in the Sidebar.

Once a gadget has been created and bound to data, you can expand the gadget by dragging
it outside the boundaries of the Sidebar, the gadget will increase its size showing
more chart elements like legends, axis labels as well as a fully functional toolbar
that enables users to change the chart aesthetics. You can click and position the
mouse over different chart elements to perform complex data analysis.
You can share these gadgets with other productivity applications like Microsoft's
Word, Excel and PowerPoint.
White Papers

If you are considering disabling Windows Sidebar, read how you can take advantage
of this wonderful platform to benefit your business and give users access to visualize
data in innovative and powerful ways, yet with minimal development efforts.